
VeeamON 2025 was a little over a month ago, and with it left a trail of new announcements and updates to soak in with its passing. This event is a huge event for everyone in the Veeam ecosystem, this means, customers, partners, community members and Veeam employees. This event is the premier event for data resilience, with deep dive content, platform announcements, networking opportunities and celebrations. During the keynote, we heard many of the features that are being included in the next version of the Veeam Data Platform –version 13! 

Along with all the announcements involving Veeam Backup & Replication, Veeam Data Cloud and new security integrations, came announcements about Veeam ONE’s new scalability and feature enhancements. This year, I had the opportunity to discuss these new features coming in Veeam ONE v13 (included in Veeam Data Platform Advanced and Premium) and beyond. This product has been one of my go-to products at Veeam since I started, it tells us so much about our backup and virtual environments, and as Rick Vanover always says, “it will tell you something about your environment that you don’t know but should.”  

Veeam ONE is a key component of the Veeam Data Platform. It powers monitoring, reporting and analytics to help customers ensure compliance, gain insights about their environment, and troubleshoot any issues occurring in real-time. By collecting data on your environment, including Veeam Backup & Replication, Veeam Backup for Microsoft 365, VMware Cloud Director, VMware vSphere and Microsoft Hyper-V, you can track efficiency, generate reports and analyze performance. This allows you to shift from being reactive to proactive, identifying and detecting anomalies to minimize downtime, and confidently know your data protection status. Let’s discuss how this will continue to develop in future releases. 


Veeam Intelligence Continues to Evolve 

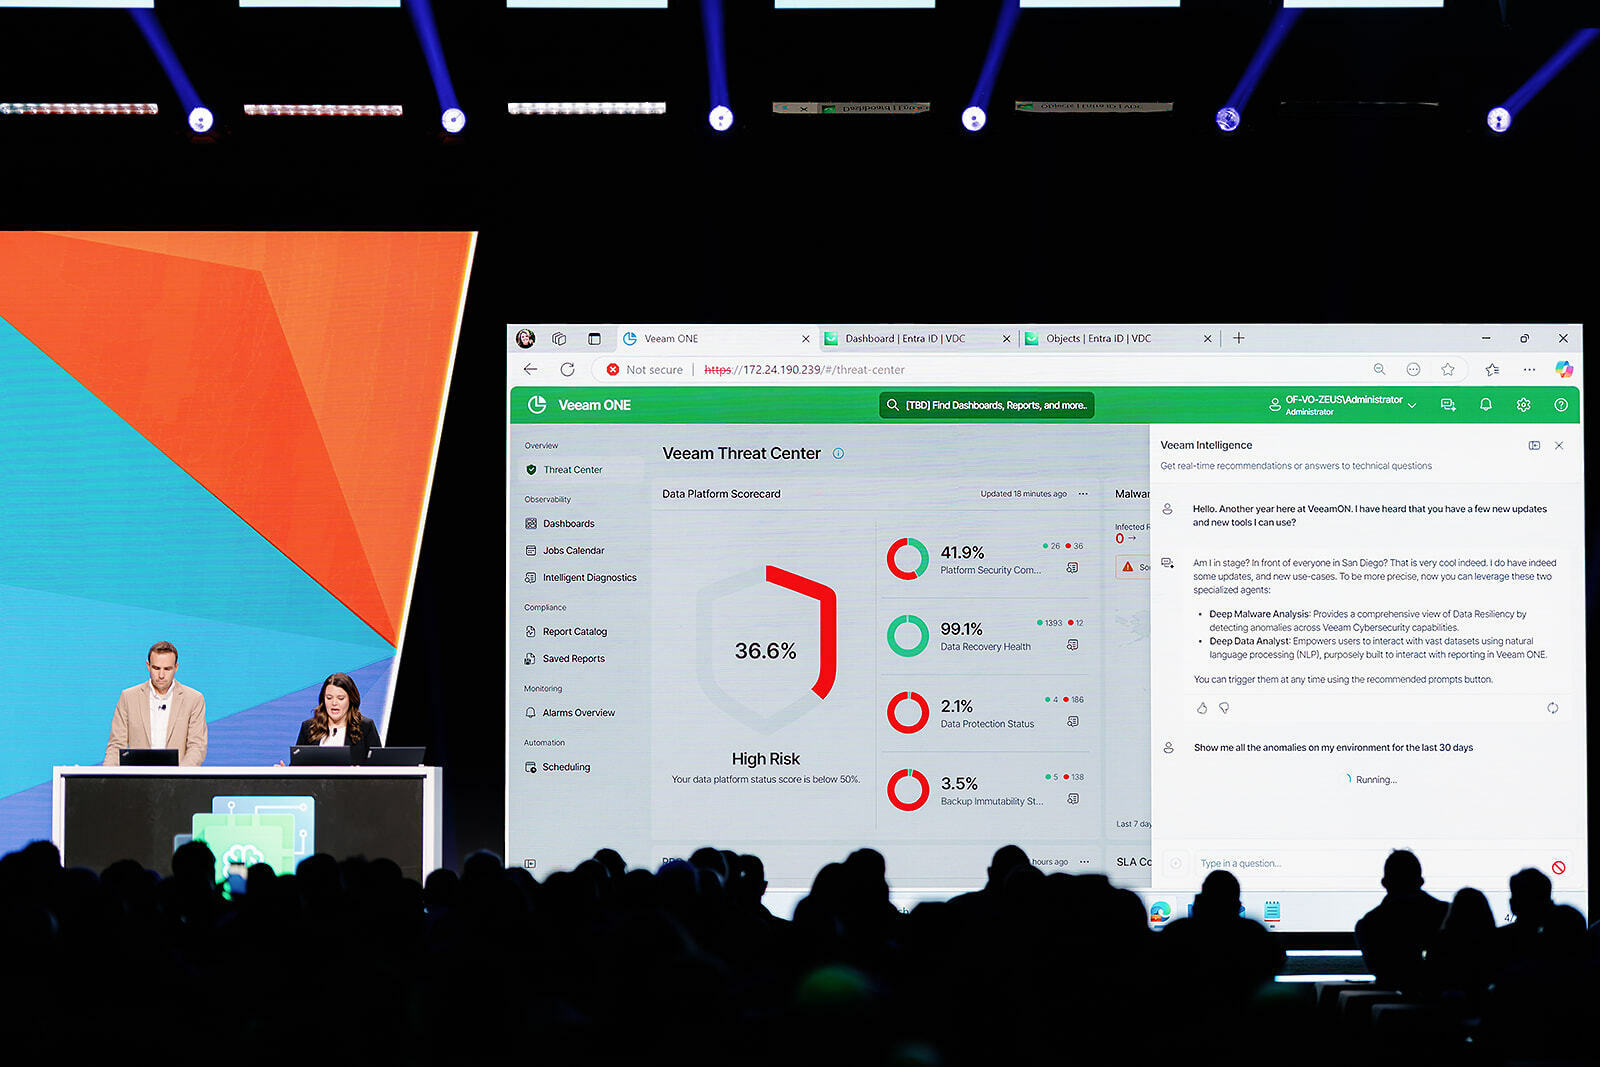
Veeam intelligence is an AI-powered solution designed to enhance data management and decision-making within Veeam’s ecosystem, providing real-time improvements to users. With its integration with Veeam ONE, it can pull data and insights by using Retrieval-Augmented Generation (RAG) and the Veeam ONE API. This allows the intelligence to retrieve information from the environment including alarms and events, threat analysis, backup job details, and server management. This intelligence continues to evolve, adding dedicated agents for deep analysis and actionable insights. At VeeamON, during the technical keynote, we announced the Malware/Ransomware Analysis Agent and Deep Data Analysis Agent. These two agents expand the capabilities Veeam Intelligence offers, going beyond just assisting customers with technical documentation but providing deep analysis of the data with more proactive-actionable insights. 

First let’s talk about the Malware/Ransomware Analysis Agent. Security is top of mind for every organization, with IT Professionals looking to continuously strengthen their cyber resilience. The Veeam Data Platform has several features that can help with this, including inline entropy analysis, signature-based malware scanning, YARA scanning, and indicators of compromise (IOC) tools detection. This agent takes it further by providing a comprehensive overview of the anomalies detected in the environment right through the Veeam Intelligence chat. From there you can facilitate self-healing actions, view malware anomalies detected by type, understand the blast radius, and identify the most recent recommended restore point. This allows you to perform additional actions, for example, performing an ad-hoc scan of a workload or triggering a SureBackup. You can see an example of this in the screenshot below. 


The second agent introduced is the Deep Data Analysis Agent.  This agent harnesses the datasets Veeam ONE collects to allow users to be more interactive with reporting. This enhances operational efficiency, because you can simply ask Veeam Intelligence to generate a report for you, eliminating the need to manually locate and run the report. Now with the reports right at your fingertips, it’s easier than ever to use reports and make decisions based on their datasets. 


Reporting Engine Powers Generation


On the topic of reporting, Veeam ONE contains a variety of reports that puts current and historical data in a readable format, allowing organizations to ensure proper protection. In the next release, a dedicated reporting PostgreSQL database will allow for better data management, and utilization while speeding up the report generation. Say so long to the days of waiting for a report to generate, you will be saying “Holy Smokes! That was fast,” with these new improvements.

The efficiency continues with a JavaScript-based reporting engine providing users with an HTML5 experience, increasing usability, accessibility and performance. With this new interface, the reporting layout gets an upgrade. Now you can see previews of reports before generation, have easier navigation through the web console, and are able to search reports based on tags. For example, say you are running Nutanix AHV and you want to see the reports Veeam ONE contains that provide data on these workloads. Simply filter by the tag, and the reports will be presented to you without having to dig through a user guide. There are more options available to scope reports, and it’s more dynamic, providing in-depth views and filtering options. Lastly you can export reports in PDF or a clean CSV.

Here is an example of what the new reporting capabilities will look like. This is the Immutable Workloads report, and you can see if looks a bit different than in previous versions, but it still provides the same critical data ensuring your data is secure.


Expanded Analytics in Veeam Data Platform 


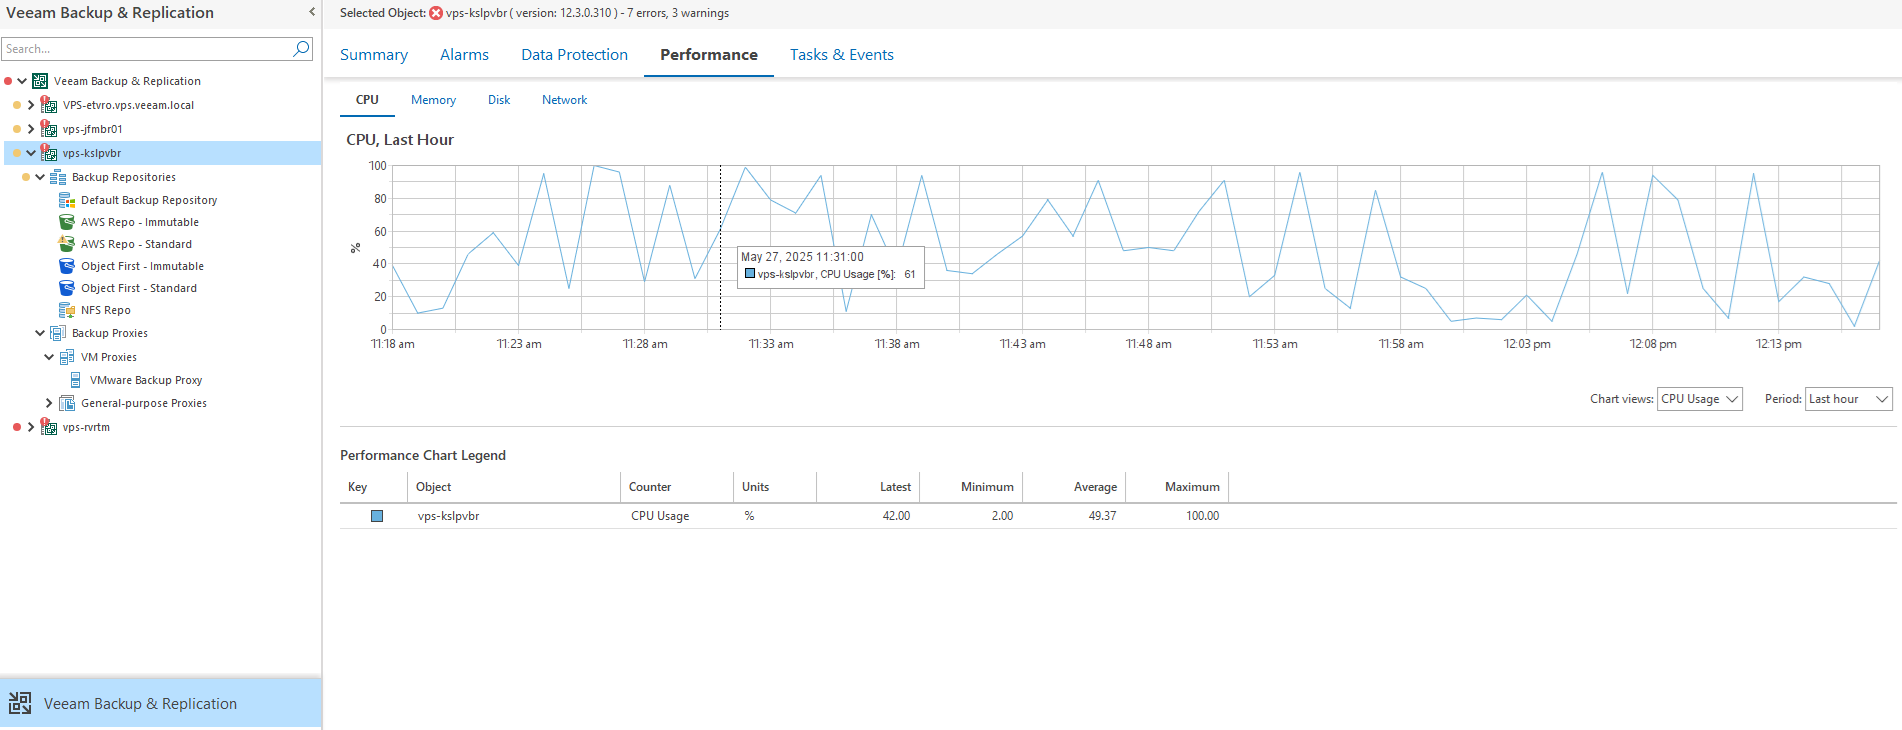
Veeam Data Platform Advanced and Premium users gain more integration within the Veeam Backup & Replication (VBR) Console. Now you can find and run reports directly from VBR, making analytics and documenting your environment even easier. For this, first, you need to check that you have the proper license and second, that you have added VBR into your Veeam ONE. From there you can view dashboards, analyze performance charts, and work with different, interactive views. This continued integration across the platform makes it easier than ever to ensure protection status, maintain recoverability, and ensure compliance. 


Just Some of What is to Come! 

Veeam ONE continues to innovate its capabilities making it easier to use, navigate and respond. It helps uncover protection gaps, mitigate potential threats, help minimize downtime and provides automated remediation and responses. Its continued dedication to support the Veeam Data Platform and its friends (Veeam Vault, Veeam Backup for Microsoft 365, and more), provides observability for on-going data resilience. This blog post is just starting to describe some of the new features that will be included in version 13, but there are a few more features you may just need to wait until the release to hear about. Before I leave you, be sure to comment if you were at VeeamON in San Diego, and which feature you are excited about! For me, it’s definitely the new and improved reporting capabilities! 

Really like what is coming and for me the new reporting enhancements that generates them faster and uses Postgres is what I am looking forward to testing.  We always have issues with reporting especially scheduled ones and most times SSRS for SQL works but the odd time it has a hiccup.  Cannot wait to test this and hopefully we get a beta like VBR. 😎


Can wait for the performance improvements to Veeam ONE. Veeam ONE in it’s current state is eating up RAM and taking forever to pull data from VBR servers. 

Great post, I can see there are a lot of things to be excited about for the future of Veeam ONE.


The Malware Analysis area looks pretty cool. 

Question Kirsten….you state above the new engine will be able to “...track changes and visualize resource utilization”. Does this mean with regards to VM CPU/Memory resources, or PostgreSQL DB, or something else? There was a Community member inquiring if VONE had the ability to monitor source VM resource utilization. I don’t think VONE is necessarily designed to do that...it’s more for BC/DR information reporting I think, but I was curious. And, if not, is something like that maybe in the works? Not necessarily to take the place of the likes of PRTG or Solarwinds, but something at least ‘basic’ I think would be interesting. Thoughts?

Thanks!


@coolsport00 - Veeam ONE currently can monitor VM resource utilization in VMware vSphere and Hyper-V environments through the Veeam ONE Client. There are a couple reports that are offered to help with this, like the VM Performance Report and vSphere Hosts and Clusters Dashboard, vSphere VMs Dashboard ( both also available for Hyper-V environments) in percentage utilized.  As you know, you need to have your virtual environment added into VONE to utilize these features. These capabilities are pretty basic yes, but let me know if I can further clarify.


Ok thanks Kirsten...you answered my question. Appreciate it!


Hi kirststoner12, is there enhancement of own backup components monitoring too? Like monitoring of cpu, memory of repositories, proxies or how many concurrent tasks on repository was used in each hour? thank you


Hi ​@Marcel.K -

Here are a few suggestions to check - if you go to the Veeam ONE Client, and select Backup Server, on the top there are a few tabs you can choose from, if you click on “Performance” there is a chart that you can see CPU, Memory, Disk, and Network Performance.

When you hover over the graph you can see % utilized. As you can see in my environment this is just checking the VBR server. 

If you drill down to ‘Backup Proxies’ and select and specific proxy, and switch to performance you gain the same charts for performance.


It looks like most of the monitoring in the Veeam ONE Client for backup repositories is for space usage and backup windows. An additional view you can look at is in the Veeam ONE Web Client → Dashboards → Heatmaps. This shows how the backup repositories are being consumed. If you click on a time of day you get more information. 

As of now, this is the monitoring we have.  However, I can forward your request to the product team, so they have it on their radar. Also, from the release and technical preview of v13 I have played with I didn’t dive deep into this, but I can check again and see if it is a feature coming soon. 


Hi kirststoner12, thanknyou very much. My point was, if in v13 will be environment linux only. If such feature will be still there…

Thanks


Fingers crossed for expanded Identity/RBAC 😃 Following VBR’s lead with SAML…..or even now that it’s more integrated with VBR, using VBR as identity source? 🙂 :)


Lots of cool new functions! I'm looking forward to testing this.
I like Veeam ONE, there are often hidden problems in the environments that would otherwise be hard to find.


@kirststoner12  Is a user still required to authenticate the ONE server to the VBR?  (this is a pain point for many, as no MFA is used for the user). It would be nice if authentication could also be done via a certificate, similar to Enterprise Manager.


Hi kirststoner12, thanknyou very much. My point was, if in v13 will be environment linux only. If such feature will be still there…

Thanks

Hi ​@Marcel.K  - Right now VONE will still be using Windows, it will support monitoring of Veeam Backup Deployments on linux.


Fingers crossed for expanded Identity/RBAC 😃 Following VBR’s lead with SAML…..or even now that it’s more integrated with VBR, using VBR as identity source? 🙂 :)

@NZ_BenThomas This is definitely on the list of feature requests!


Lots of cool new functions! I'm looking forward to testing this.
I like Veeam ONE, there are often hidden problems in the environments that would otherwise be hard to find.


@kirststoner12  Is a user still required to authenticate the ONE server to the VBR?  (this is a pain point for many, as no MFA is used for the user). It would be nice if authentication could also be done via a certificate, similar to Enterprise Manager.


Hi ​@PeteSteven - I like you're thinking here 🙂 I think this would be an awesome feature within VONE. Right now, I will have to check and see if this is something that will be in the next version or in a future version, but from what I can remember I think VBR will be added to VONE as it has been traditionally. Thanks!


Thanks for the sneak preview ​@kirststoner12. Can´t wait to get my hands on v13. Will it be possible to monitor hypervisors other than vSphere and Hyper-V in the future? 


Hi ​@CMF - Right now, we can monitor data protection jobs protected by other hypervisors like Proxmox, Nutanix, oVirt KVM. The focus of Veeam ONE is to support and monitor the data protection operations. There have not been any updates for now on monitoring for other hypervisors.


The Malware Analysis area looks pretty cool. 

Question Kirsten….you state above the new engine will be able to “...track changes and visualize resource utilization”. Does this mean with regards to VM CPU/Memory resources, or PostgreSQL DB, or something else? There was a Community member inquiring if VONE had the ability to monitor source VM resource utilization. I don’t think VONE is necessarily designed to do that...it’s more for BC/DR information reporting I think, but I was curious. And, if not, is something like that maybe in the works? Not necessarily to take the place of the likes of PRTG or Solarwinds, but something at least ‘basic’ I think would be interesting. Thoughts?

Thanks!

It does a great job tracking CPU/Memory/Disk usage


You can monitor from VMware or give it access to the VM’s as well. We use it for reporting on free disk space on servers and sending out alerts.   The reporting is one of the most impressive features of VeeamONE. More so that just on the Backup/DR infra but on your VMware environment, storage etc. 


I am very excited to be able to ask it to generate me reports that come to mind rather than trying to create them or look for specific ones. 


If there is one thing I’d love to have, is more dashboards or specifically, more dashboards that look nice on TV’s with the ability to configure thresholds for specific colors. Think of a simple Grafana dashboard where i can show my top 5 VM’s for CPU/Memory, or all of them, but allow me to turn one red if a CPU is at 100% for 4 minutes or something like that :) 


Most dashboards are great on monitors, but not on a large wall mounted display in an office.  


@coolsport00  in regards to my last post, you can configure email alerts on all kinds of metrics too, or give specific access to users to view different VM’s, utilization. 


It is very much like PRTG/SolarWinds in those regards. 


Great, thanks Scott! 👍🏻


Comment